


Legal Disclaimer – This research is not an investment advisory or a sales pitch.
Objective
- Identify the relationship between asset prices (main stock indices, commodities, bonds) and macroeconomic data for US, UK and EU.
- Determine whether the trend in macroeconomic data can indicate the trend in asset prices
Data
- US, UK and EU monthly main macroeconomic data for last 20 years (Jan 99 – Sep 19) was used for independent variables (X).
- Average monthly close price over the same period was used for asset prices (main stock indices, commodities, bonds) as the dependent variable (Y).
- All 3 countries’ macroeconomic data was combined to see their impact on each asset price.
- Historic Asset price data has been sourced from public data sets. Macroeconomic data was taken from our website https://datawisdomx.com, which sources data from reliable well-known data providers.
Asset price and Macroeconomic data relationship
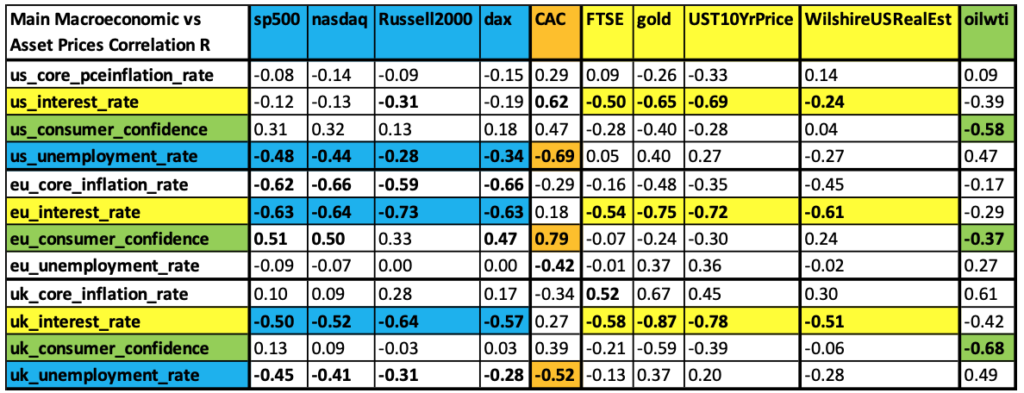
- Relationship between asset price and macroeconomic data was assessed using Correlation coefficient and Coefficient of Determination
- All 3 countries’ macroeconomic data was correlated against each asset price (irrespective of country)
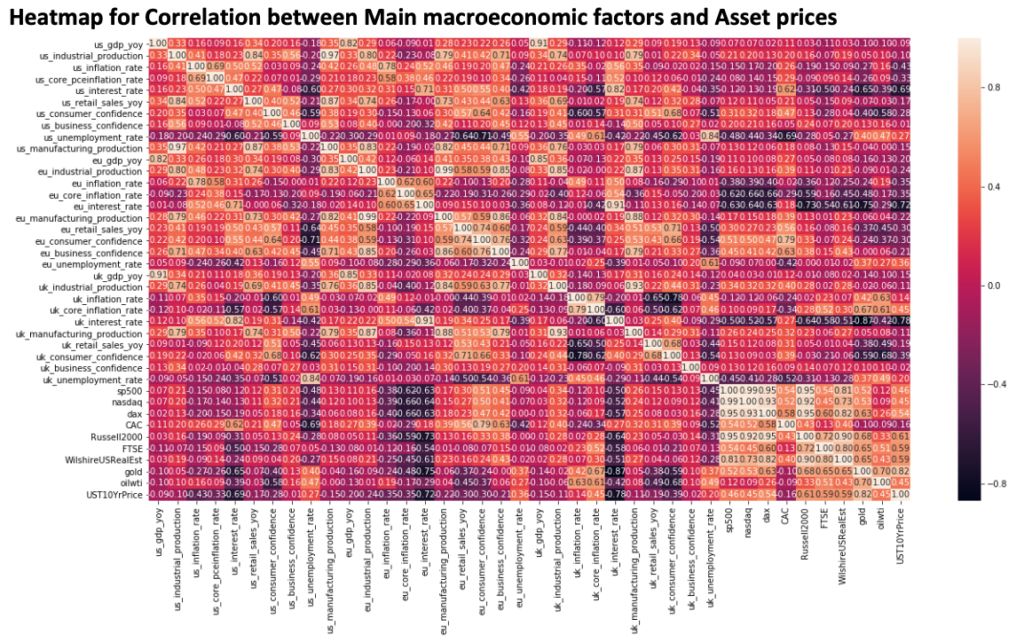
- Only the main macroeconomic data
for each country was considered as they have the maximum impact and show
the strongest correlations (interest rate, inflation, GDP rate, consumer &
business confidence, manufacturing production and unemployment)
- Where the macroeconomic data was highly correlated, only one was used. Eg: Manufacturing and Industrial production have R > .93 for all 3 countries
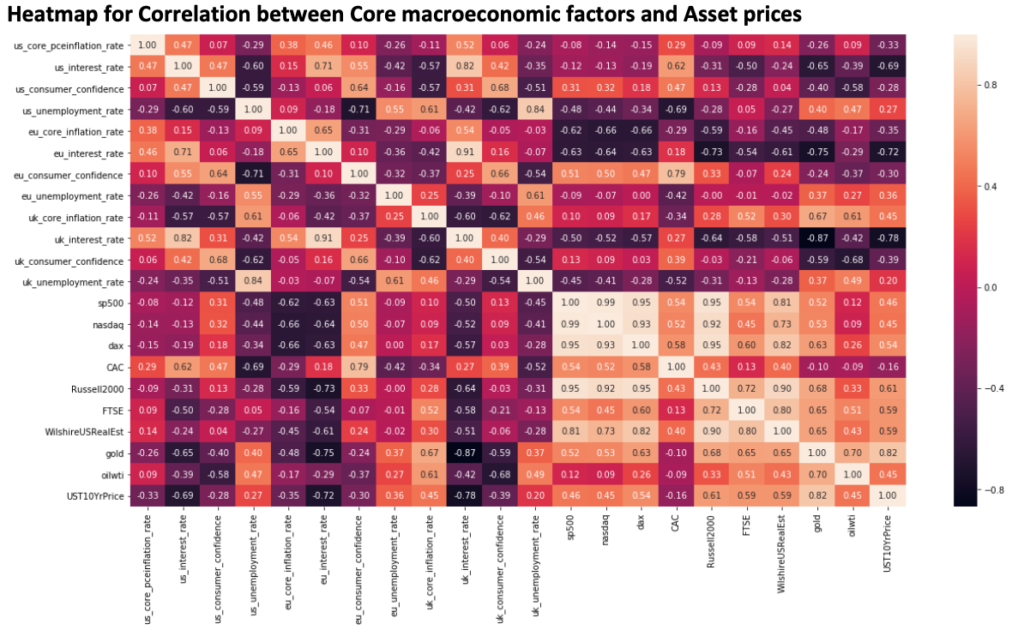
- Of the main macroeconomic data for each country, core data showed the strongest correlations (interest rate, core inflation, unemployment and consumer confidence)
- Results are shown in a heatmap and given in excel for easy visualization and comparison
- Generally, Correlation
coefficient R larger/smaller than +0.5/-0.5 are considered, except in some
cases where they are weaker but still the most significant for a country’s macro
data vs asset price combination
- Main US stock indices S&P500/Nasdaq/Russell2000 and German DAX show -ve correlation to different macro factors (Unemployment Rate, Interest Rate) in each country
- FTSE/Gold/USTreasury 10year bond price/ Wilshire US Real Estate index show -ve correlation to the same macro factor (Interest Rate) in each country
- WTI Oil show -ve correlation to the same macro factor (Consumer Confidence) in each country
- CAC correlates +ve and -ve to different macro factors (Unemployment Rate, Consumer Confidence) in each country
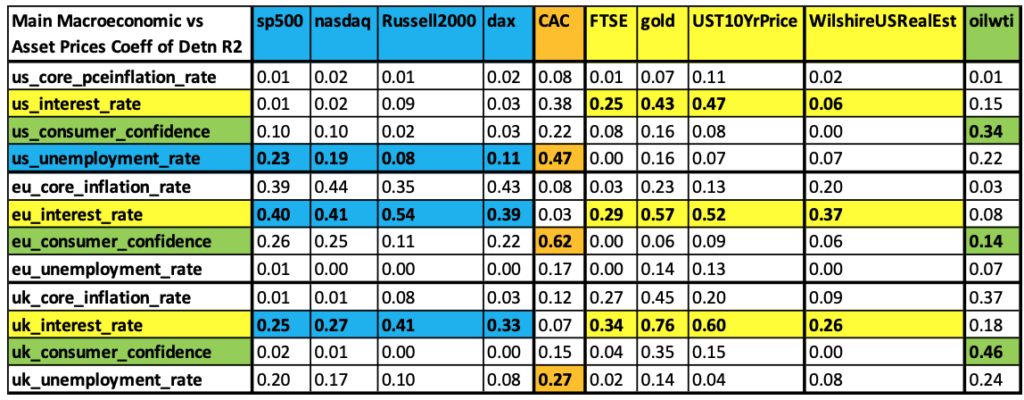
- Coefficient of Determination R2 was also used to further confirm
whether the correlated macro factors can explain the variability in the asset
price
- Results were mixed with some >0.5 but most less than that. But they were still highest for the factors which showed the highest correlation ‘R’, so giving the results further validity
- It’s worth noting that most risk assets (stock indices) are highly correlated with each other and so are commodities, bonds and real estate with each other
Results Analysis
- Stock indices being risk assets depend more on consumer sentiment,so low
interest rates and unemploymentincrease appetite for risk. Again, with
low rates, historic low unemployment, slowing global growth and peak asset valuation,
risks are tilted to the downside
- Bonds, Gold, Real estate, commodity heavy indices are strongly dependent on interest rates as confirmed by the results. With low interest rates globally and expectation of more cuts, expectation is for further gains in Gold and Bonds as they are safe haven assets, while real estate is suffering globally from high inventory and prices
- Oil is driven by supply/demand factors. There is sufficient supply globally, apart from some intermittent disruptions, with OPEC cutting output to support prices. Demand is falling due to slowing global economy, as indicated by consumer confidence and other macro factors. Prices are back to lows as a consequence
- CAC is showing results different to most stock indices, despite having a good mix of different industry sectors with global companies. While it is correlated to unemployment rate, there is a weak relationship to interest rates. This will need to be analysed further. But with -ve risk sentiment, risks remain to the downside.
Market Analysis relative to Results
- As macroeconomic data worsens (falling inflation/growth, rising unemployment), asset prices fall/rise depending on type – stocks, bonds, commodities. Central banks respond by cutting interest rates (and doing QE – Quantitative Easing) to support economy which normally reverses the economic slowdown to some extent.
- Looking at the last 20 years data, there is a strong relationship between asset prices and macroeconomic data. However, if broken into two 10 year time frames (1999-2008, 2009-2019), the relationship has broken down/reversed in some cases as since the 2008 credit crisis central banks have kept interest rates at historic lows (close to 0 except for US) and are still doing QE or restarting again (EU).
- This has caused asset prices to
inflate with strong correlation with risk assets. But the market had peaked
in 2018 (tested a couple of times) with a severe crash in December ’18 (US
China Trade war, Brexit, EU/China/Japan slowdown, big tech companies facing
growth/legal issues, OPEC cutting demand forecasts, central banks turning
dovish).
- Market Analysis notes relating to this published for CurrentiaX in Nov/Dec ’18 are given at the end of this document
- The market recovered in H1 2019 but the same risks in 2018 have reappeared and are worse than they were in 2018 along with a much weaker global economy. Along with that interest rates are already at lows (0 or -ve too) in EU, UK, Japan, etc.
- Looking at the global economy, it
faces many headwinds including
- Global economy is far weaker now in 2019 than it was in 2018. EU, UK, China and India’s economies have slowed significantly with a possible recession for some of them. Trade war impact and global slowdown have been the biggest factors.
- Trade war is getting worse as neither US or China are willing to compromise, and US has now put tariff’s on EU products too.
- Democrats are looking for possible impeachment proceedings against Trump, but it’s not clear if there is a legal case for that. This is increasing the -ve uncertainty on the global economy.
- Brexit is still not resolved and there is a lot of disagreement between/within political parties on what the exit plan will look like. No-deal is still possible as EU has rejected Boris Johnson’s latest proposal. This has had a huge -ve impact on UK’s economy and EU/Others too
- Most export driven economies are feeling the impact of China’s slowdown, Germany, Italy, Asia, others. This is further adding to the global slowdown
- Central banks are cutting rates (EU, US, India) and restarting QE but it has had limited impact. This is because rates are now turning -ve in many countries (inverted yield curves) which impacts savers/pension funds/bond holders. Hence, there is limited scope for further rate cuts in most countries and its +ve impact
- Most risk assets have started reversing and unable to breach their 2019 high’s. Oil is back to its lows despite the attack on Saudi Arabia’s main oil processing plant, due to sufficient global production capacity and expected fall in demand
- India too has taken some drastic steps like cutting interest rates and corporate tax rates to boost the economy. But that has had limited impact due to the global slowdown and the banking/real estate crisis continuing to grow.
- Large tech IPO’s have been disappointing due to unrealistic valuation/growth issues. Most companies have indicated flat/lower growth in 2019 and 2020 due to all of the reasons above.
Conclusion
- The analysis indicates that further rate cuts won’t have much impact and restarting QE will not have the same impact as 2008 as most assets are at peaks (highly inflated). With a slowing global economy there is limited scope for further gains
- We are now in ‘Q4, final quarter of the year when the desire to taken on risk is very low, as most positions and companies prepare to wind-down for the year. There is a strong possibility for a further sell-off this year given these conditions and we could even see a repeat of 2018
Charts comparing macroeconomic data for 2018 and 2019
- Further visual comparison between macroeconomic data for different years can be done by using line charts. Code is given and users can easily manipulate different combinations to see the trends in relation to the results and analysis
Sample code, Data and Results
Data used for this analysis along with sample code and results are given in the below Github location – https://github.com/datawisdomx/Monthly-Asset-price-relationship-to-Macroeconomic-Data
Note – This research is based on a very simple premise and small data set. This by itself not sufficient for all possible variations to the relationship between the macroeconomic data, asset prices, timeframes and other factors like political & central bank data, etc. Users can test that on their own and use as they see fit.
Note – A follow up research article will be published which will use regression to predict asset prices based on the above analysis
Market Analysis relating to this published for CurrentiaX in Nov/Dec ’18
18 Nov 18
Market Analysis
Bullish on USD. Bearish on GBP, EUR, INR, JPY, Stocks, Gold and Oil.
US
Mixed data from US. Inflation continues to rise with good retail sales. But deficit has widened and TIC flow has fallen. Primarily due to more federal spending, trade war impacting demand for US assets along with asset rotation to other markets as US markets have peaked. Shouldn’t be a problem given strong growth, tight labour markets and US outperforming all other major economies. Trade discussions are ongoing with China but there doesn’t seem to be any clear agreement and whether the new $250bn in tariff’s will be imposed. Some Fed members have made dovish comments on rate rises in relation to neutral rate (3.5%) and global economic slowdown. But December raise is still expected and 2019-2020 were expected to see slower raises. Dollar sold off a bit because of these DXY back to 96.5. Remain Bullish on USD.
UK
Brexit is turning into a disaster. May’s proposal is being rejected across party lines. Her own cabinet members are resigning and letters are being sent for a no-confidence vote (38 known of 48 required). Bigger issue is that the Brexit proposal is a farce, worse than current EU membership. No freedom to set competition, employment, labour regulations, tax rules, state aid, environmental regulations, etc. EU rules will still apply. What exactly have they negotiated? And when will the outstanding issues like Irish backstop be resolved, possibly never. EU is making sure Brexit fails eventually. No-deal is a much better option. If May possibly survives no confidence vote, the Brexit plan still needs to pass in parliament, then they need to “keep negotiating” with EU till 2021. This is not good for UK economy. Uncertainty for 2 years with such a bad deal, with already weakening data will make it worse.
Most data is weakening including inflation, retail sales and retail prices. Only employment data is steady. GBP is back at 1.28. Remain Bearish on GBP.
EU
EU is facing a severe fall-out from the trade war and global economic slowdown, being export driven, especially Germany. German GDP contracted by -0.2% and ZEW survey remains -ve. Italy budget disagreement continues. Most data are showing flat growth with employment falling. ECB will probably maintain their current dovish stance given the slack in the economy and low core inflation. Brexit, while not having an immediate impact, will become an issue if there is a no-deal Brexit, which is a possibility. Impact of strong USD continues to be felt. EUR has bounced back to 1.14. Remain Bearish on EUR.
China/Japan/Emerging Markets/India
Chinese credit tightening continues with money supply/financing/loans falling. Other economic data is slowing too. There is no agreement on the trade tariff’s yet and the global slowdown is impacting import/export flow. Chinese economy will continue to cool.
Japanese economy continues its roller-coaster growth with GDP contracting by -1.2% QoQ in 3Q. BoJ now has a balance sheet larger than the economy, that should be a warning sign. Global slowdown, trade war and highly leveraged balance sheets are impacting growth along with one-off natural calamities. The 0% rates and huge monetary expansion they have been doing for decades has not solved the fundamental population/demand contraction they are facing. USDJPY is back at 113. Remain Short on JPY.
Indian economy is steady with falling oil prices reducing inflation. Politics will be a big driver for the next few months due to state elections. USDINR is back at 72. But with strong USD, slowing global growth, 75 and beyond can be tested. Remain Bearish on INR.
Stocks, Gold, Oil
Global stock markets, especially US, continue to be sold-off. Bounce backs are shorter. The bearish trend continues. More tech companies reporting falling earnings/growth projections. Global economic slowdown/tightening liquidity/rising rates/inflated assets/global deleveraging/US-China trade tariffs continue to impact risk-off mode. Brexit mess/EU Italy issues could impact global trade flows. Nasdaq is testing 6800. Remain Bearish on Stocks.
Gold has bounced back to 1220 due to US-China trade tariff uncertainty, stock sell-off and Brexit mess. But given receding geopolitical risks/falling inflation/rising rates/strong USD/tighter monetary policy/slowing global growth, gold demand remains limited. Remain Bearish on Gold.
Brent Oil tested lows of $65 post OPEC demand falling and supply increasing bearish report. This was expected for a while considering global slowdown, strong USD, monetary tightening, increasing supply. Oil producing countries geopolitical risks and Iran sanctions have faded too. Demand for other commodities has also been falling/at lows due to some of these factors. Remain Bearish on Oil.
15 Dec 18
Market Analysis
Long INR, JPY, EUR, Stocks (India, China) Gold, Bonds (US, India).
Short USD, GBP, Stocks (G7), Oil.
US
US economy is starting to slowdown as visible in the recent data. Impact of China trade war, global slowdown, and high rates is being felt. Inflation/Prices/Retail sales are falling, forward looking indicators like ISM/PMI are falling, US stocks are getting sold, oil is back below $60, 2s10s spread tested lows of 11bps and Fed has been making dovish messages. Expectation is for December to be last raise for now and only one more for 2019 if required. FOMC minutes will be closely watched for any indications. US economy/stocks have peaked for now though still outperforming G7.DXY is staying below 98. Short USD.
UK
Brexit has turned into a disaster with May’s renegotiation visit totally rejected by EU. There is no desire from EU to work with UK as their objective is to make Brexit fail. She faces revolt at home with calls for another referendum/election despite surviving a no-confidence vote. Most economic data is weakening with inflation/prices/house prices/manufacturing, industrial production falling. Only unemployment/wages are steady. BoE has maintained its No-deal Brexit recessionary stance. Brexit having severe impact on UK economy. GBP went below 1.25 with 1.20 (Brexit vote lows) in sight. Short GBP.
EU
EU economy is also weakening with most data falling. Inflation/PMI falling with France seeing contraction due to widespread public protests against fuel tax hike. Italy budget issues seem to be subsiding as Italy is ready to negotiate, though nothing firm yet. Impact of trade war and global slowdown is being felt in export driven economies like Germany. Brexit is also impacting EU as no-deal Brexit will restrict free movement of goods and services. ECB has confirmed slowing growth, falling inflation (“balance of risks [to the growth outlook] is moving to the downside”) and no rate hikes till 2019 despite APP ending (but still reinvesting principal payments). EUR is stuck in a tight 1.12-1.15 range.But relatively EUR is looking oversold as their economy is growing at a healthy rate with rising wages. Long EUR.
China/Japan/India
Chinese economy is facing severe impact from US trade war and global slowdown. Most economic data is falling including inflation/retail sales/industrial production/FDI. Chinese housing market continues to slowdown. This is impacting global growth and will continue as liquidity tightens. Loan growth/money supply are being curtailed by the govt to reduce the impact of bubble in credit/real estate markets. However, Chinese stocks are oversold considering the size and future growth potential (6%+) of the economy.
Japanese GDP contracted by -2.5% in 3Q, more than expected. Most other data is steady. However, trade war and global slowdown impacts them too being a net lender to the world and an export driven economy. Japanese stocks are overbought. With global risks rising and US peaking JPY is a safe haven. Long JPY.
India saw some reversal in politics with BJP losing and Congress/local parties winning all 5 state elections. This will make 2019 elections tricky and Modi/BJP will have to consider some of their policy measures. RBI governor Patel resigning suddenly also created doubts about monetary policy. All this weighed on INR and stocks. However, BJP did not lose by a big margin in the big states and new RBI governor Das is more in line with govt views. This should enable economy friendly policies and possibly boost Modi/BJP election chances. Inflation is falling (supported by low oil prices) and economy is expected to grow at a very good 7%+ rate, outperforming all large economies. USDINR tested 72.5 again but with USD peaking, falling inflation/oil prices, 70 and below can be tested. Long INR.
Stocks, Bonds, Gold, Oil
Global stock markets are seeing very high volatility with any bounce back getting smacked. Confusion around US China trade deal and arrest of Huawei CFO caused huge whipsaw moves. Both are starting to resolve but now there are serious concerns about growth in 2019 and impending recession. Most global economic data is weakening and central banks are turning dovish. Any wage inflation is being countered by low energy prices / falling inflation. Companies will struggle to beat growth/profit targets in 2019 in this environment. Tech stocks continue to get sold heavily. Apple and its suppliers keep confirming falling iPhone demand and Facebook’s privacy issues keep increasing. Most G7 economies stocks are overbought especially US/UK/EU/Japan relative to emerging/growth markets. Short G7, Long India/China Stocks.
US Yield curve flattening continues with 2s10s testing lows of 11bps (below 0 indicates impending recession) and yields falling across most economies. Most central banks are turning dovish. UK/EU have no scope for cutting rates in the near term and Japan has been at 0 for a long time. US and India bonds have been the most oversold considering their yields relative to the slowing economic/falling inflationary environment. Long US/India Bonds.
Gold continues climb higher (above $1240) with USD peaking/slowing global growth/ flattening rates/falling stock prices/weak housing market creating need for asset diversification. Long Gold.
Despite OPEC cuts of 1.2mn bpd Brent oil is back below $60. This was expected and demand is expected to fall further with increased supply from US/Others. OPEC themselves predict 2mn bpd fall next year. Unless they do more drastic cuts, remain Short Oil.
Disclaimer
Please use this research keeping in mind the disclaimer below.
Please get in touch if you see any errors or want to discuss this further at nitin@datawisdomx.com