


Building a #datascience #machinelearning #algorithm is relatively simple.
8 lines of #python code.
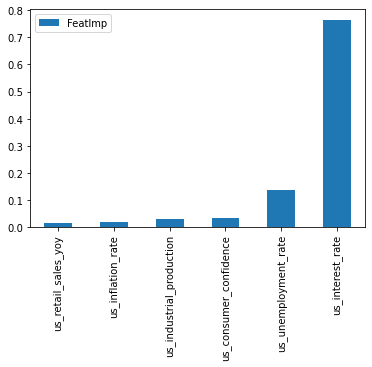
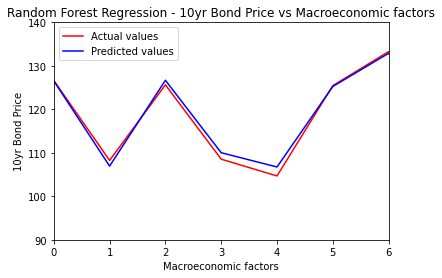
It’s the other process steps that require most of the work – problem definition, #datawrangling, model selection, #optimization, deployment, continuous improvement. Giving an example to build a #randomforest model for predicting US 10year #treasury #bond prices using a few #macroeceonomic data points.
Charts show good accuracy
Code github – https://github.com/datawisdomx/DataScienceCourse/blob/main/Part1-MachineLearningandDataAnalytics/Examples/Chapter8_Regression/Chapter8_RandomForestRegression.py
Lecture with code is available on youtube – https://www.youtube.com/watch?v=2orjwpnLiS8
Entire course is available on udemy – https://www.udemy.com/course/datascience-e2e-beginnerscourse-machinelearning-dataanalytics/
# 1. Import Bond Price and macroeconomic data for US
usmacro10yrpriceyielddata = pd.read_csv(‘../DataScienceCourse/Part1-MachineLearningDataAnalytics/Data/USMacro10yrPriceYield.csv’)
# 2. Split the data into dependent y and independent X variables
X = usmacro10yrpriceyielddata.iloc[:, 1:7].values
y = usmacro10yrpriceyielddata.iloc[:, 7].values
# 3. As y is a 1 dimensional array, and the algorithm expects a 2D array
# we need to reshape the array. Using numpy reshape method this can be done easily
y = y.reshape(-1,1)
# 4. Split the data into training and test set
X_train, X_test, y_train, y_test = train_test_split(X, y, test_size = 0.25)
# 5. Create the random forest regressor
estimator = RandomForestRegressor(n_estimators=100, criterion=’mse’, min_samples_leaf=1, min_samples_split=2,
max_features=’auto’, random_state=42, n_jobs=-1)
# 6. Fit the estimator to the training data to build the model
estimator.fit(X_train, y_train)
# 7. Using the estimator predict y values using the X test data
y_pred = estimator.predict(X_test)
# 8. Calculate error metrics for predicted y values vs y test data
mse = mean_squared_error(y_test , y_pred)
rmse = np.sqrt(mse)
# Plot the results – code is available in lecture