


Predict 3 year Forward Asset Prices & Direction and Portfolio Return & Risk using Historic Macro data & Central Bank Forecasts
This algorithm was published earlier. Sharing it again as it is still relevant given the changing macroeconomic environment. Got good results earlier for market direction for multiple periods. Please read the disclaimer at the end.
However, it requires updated data till 2022 – macro and asset price. Used RandomForest and XGBoost algorithm but can try deep learning techniques too. Overview of algorithm is given below and in the document
https://github.com/datawisdomx/RoboAdvisorAlgo-Part1/blob/main/RoboAdvisorAlgoPart1_7Jan20.pdf
Updated code / data is in github location:
- Overall – build a RoboAdvisor algo that can automatically construct and re-balance a multi-asset portfolio using forward predicted asset prices for different timeframes
- Create a medium to long-term portfolio for small/medium investors (low investment amount > $500, covers majority of the population)
- Part 1 – Predict 3 year forward monthly average asset prices and direction (stock indices, commodities, bonds, currencies) using historic macroeconomic and central bank forecasts for US, UK and EU. Only the 5 main macro factors were used
- Part 1 – Predict forward Return and Risk for a multi-asset portfolio (stock indices, commodities, currencies, real estate, bonds) using pre-defined asset weights and predicted forward monthly asset prices for different time frames – 3 months to 3 years
- Part 1 – Backtest the results by comparing predicted historic asset prices against actual for historic actual macro data
- Part 2 – Find optimal portfolio weights for maximum return and minimum risk
- Part 2 – Automate portfolio construction and re-balancing
- Part 2 – Use India, China. Not considered due to lack of historic govt bond price data
- Part 2 – Build a model to forecast macro data using all other macro data, to use for forward price prediction
Data
- US, UK and EU monthly main macroeconomic data for last 21 years (Jan 99 – Dec 19) was used for independent variables (X).
- Average monthly close price over the same period was used for asset prices (main stock indices, commodities, bonds, currencies) as the dependent variable (Y).
- All 3 countries’ macroeconomic data was combined to see their impact on each asset price. Only the 5 main macro factors (forecasted by central banks) were used for 3 year predictions – interest rate, core & headline inflation, GDP, unemployment
- Historic Asset price, Macroeconomic data has been sourced from public data sets and our website https://datawisdomx.com, which sources data from reliable well-known data providers.
Algorithm Logic – Forward Asset Price Prediction
- For 3 year forward price/direction forecasts, central bank forecasts were added to historic actual macro data in monthly forward loops
- Model is trained and tested using Historic + Forecast Macro data to predict forward asset price
- Predicted asset price is then added to historic data for re-training model and predicting for next forward timeframe
- For forward asset price prediction for month ‘t’
- Model is trained/tested on asset price and macro data till ‘t-2’
- Macro data for ‘t-1’ is then used to predict asset price for ‘t’. This ensures it is not used for training/testing the model (prevent leakage)
- Forward Price Asset model: FPAt = RFModelt-2 (Macrot-1)
- t = 1 to 36 (3 years, 36 months). i = 1 to 251 (Jan ’99 – Nov ‘19)
- For [t=1, i = i + (t-1)]
- RFModelt-2 = Random Forest (Ai, Mi)
- Macrot-1 = Macroi+1 (Dec ’19)
- For [t >1, i = i + (t-1)]
- RFModelt-2 = Random
Forest (Ai, Mi). (Jan ’99 – Dec ‘19)
- Ai = Ai + At-1. Ai = Actual, At-1 = Predicted using model
- Mi = Mi + Mt-1. Mi = Actual, Mt-1 = Central bank forecast
- Macrot-1 = Macroi+1 (Jan ’20). Central bank forecast
- This loop runs till entire 3 year forward prices are predicted
- Eg: Asset price for Jan ’20 was predicted using Macro data for Dec ’19 and model was trained using asset price and macro data upto Nov ‘19
- Limitation – Only the 5 main macro
factors (forecasted
by central banks) were used for 3 year predictions – interest rate, core &
headline inflation, GDP, unemployment
- Forward 3 year forecasts for other macro data like industrial/manufacturing production, consumer/business confidence, retail sales is not available/reliable
Note – Tried to build a model to use all macro data to predict another macro data. Results were not good / degraded as time frame was increased beyond a few months
Algorithm setup details
- Standard python scikit-learn, pandas, numpy, visualization libraries were used for running the different algorithms in python
- Regression algorithms used – Random Forest. XGBoost was considered but not used
- The data was split into test and training sets, with a test_size = 0.25, as that gave better results compared to 0.2 or 0.33 or other variations.
- Feature scaling – Data wasn’t
standardized as it would require the new independent data vector for new price
prediction to be standardized using the trained models mean/variance
- Also, with Random Forest/XGBoost algorithms it’s not necessary as they are based on decision tree ensemble model (Bagging/Boosting), which does not require standardization (not distance based)
- Metrics used for
evaluating the algorithms were
- MSE – Mean Squared Error, RMSE – Root Mean Squared Error
- MAE – Mean Absolute Error, R2 – R-squared
- Hyper
parameter tuning – was done using GridSearchCV
- It ensures that multiple variations of the data sample are used by shuffling it randomly for k-fold splits, thereby preventing overfitting on the same test data and reducing bias
- Below hyper parameters gave the best results
- RandomForest – n_estimators=1000, criterion=’mse’, min_samples_leaf=2, max_depth=17, min_samples_split=2, max_features=’sqrt’, random_state=42, n_jobs=-1
- Python code for data wrangling, GridsearchCV hyperparameter tuning for each model, model explanation details for Random Forest and XGBoost and data visualization is given in github – RoboAdvisorAlgoPart1_7Jan20.py
Portfolio Construction, Return and Risk Logic
- Portfolio is constructed using a typical composition of different asset classes – Stock Index, Bonds, Gold, Real Estate, Currencies, Cash, Commodity Index
- Create a medium to long-term portfolio for small/medium investors (low investment amount > $500, covers majority of the population)
- Investment strategy will determine asset class and weight allocation. Example:
| Low risk | Medium risk | High risk |
| Conservative | Moderate | Aggressive |
- Highly liquid, Daily priced, Exchange traded Indices/Assets futures were
considered
- Kind of assets most small investors understand/prefer
- Easy and cheap to buy/sell, price, benchmark, backtest
- Very low risk of price manipulation and default, unlike illiquid/alternative assets
- Portfolio Return = Weighted sum of asset returns,
over a given period (months to years)
- Portfolio Return = ∑i=1 to n ARi * Wi
- AR = Asset Return for period (Yearly/Monthly)
- W = % Weight of Asset in Portfolio for period
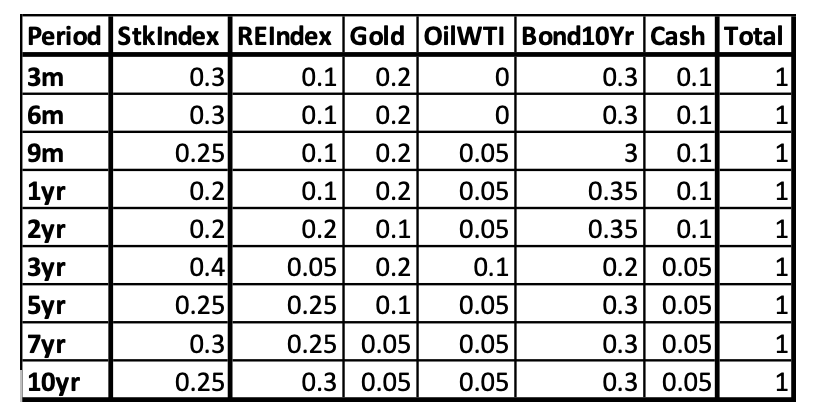
- Portfolio Weight grid example:
| Period | StkIndex | REIndex | Gold | OilWTI | Bond10Yr | Cash | Total |
| 3yr | 0.4 | 0.05 | 0.2 | 0.1 | 0.2 | 0.05 | 1 |
- Asset Annual Return rate is
calculated using Start/End of Year Asset Price
- Asset Annual RR = (APEoY – APSoy)/APSoY
- Asset Monthly Return rate using
Start/End of Month Asset Price
- Asset Monthly RR = (APEoM – APSoM)/APSoM
- Asset Annualized return using
Monthly Return rate of Asset
- Asset Annualized Returns AAR = [(1+amr1)*(1+amr2)…*(1+amrn)]^1/n – 1
- amr = asset monthly return
- Bond (10 year government – US,
UK, EUBund) returns were calculated using futures price and average yield,
instead of normal bond calculation (Coupon, YTM, Period, Par)
- As bond will most likely not be held to majority, futures price gain/loss is used for calculating return. Coupon is close to average yield of bond futures
- Bond Annual RR = [BondPrice(EoY-SoY)+ MeanBondYield(EoY To SoY)] / BondPrice(SoY)
- Bond Monthly RR = [BondPrice(EoM-SoM)+ MeanBondYield (EoM To SoM)]/ BondPrice(SoM)
- For UK, EUBund bond futures price data is available only from Mar ’08
- Portfolio Risk – Variance (Volatility) is calculated using the standard Modern
Portfolio Theory formula which considers both risk and correlation of the
assets in the portfolio
- Variance(Portfolio) = Volatility
- V = ∑i=1 to n (Variance(ARi)*Wi^2) + ∑i=1 to n∑j=i+1 to n [2*Wi*Wj*Covariance(ARi,ARj)]
- Covariance(ARi,ARj) = CorrelationCoefficient(ARi, ARj)*SDARi*SDARj
- SDAR = Standard Deviation of Asset Return
- Portfolio Risk – Standard Deviation measures deviation of the returns from
the mean
- Standard Deviation (Portfolio) = [Variance(Portfolio)]^1/2
- Explanation of risk terms
- Variance (x) = ∑i=1 to n((xi-Average x)^2)/n. Spread from mean. Excess weight to outliers
- Covariance (x,y) = ∑i=1 to n[(xi-Avg x)*(yi-Avg y)]/n-1. Directional relationship between returns of 2 assets (x,y)
- Correlation Coefficient – Strength of relationship between 2 assets -1 to 1
- Standard Deviation of Portfolio. Dispersion from mean. Same unit as data
- Portfolio
Weight grid different timeframes sample.
- Portfolio weights have to be optimized for different time frames and asset mix – will be done in part 2
Backtesting Logic
- Backtesting is used to measure the
accuracy of the model (which uses central bank forecast data) by using the same
logic for predicting asset prices using actual macro and asset price data
- Predict asset’s monthly average price using actual Macro data for US, UK and EU
- Loop in reverse, start at last year and month of actual data, drop 1 month each time, till last 1 year (1999) of Macro data is left
- Use macro, asset data till t-2 to train model. Then t-1 macro data to predict asset price for t
- We need at least 1 year’s macro, asset data to predict future asset price
- Accuracy – This allows us to measure how accurately the
model is predicting asset prices
- (Predicted monthly asset price – Actual monthly price) for historic data
- Direction – Calculate Predicted vs Actual
direction using actual prices and macro data
- Since predicted prices are consistently below actual price due to random forest algorithm’s limitation, we can use asset price monthly direction as another measure to backtest
- t = 1 to [(last year and month)-1] of actual data
- Actual directiont = Actual Pricet – Actual Pricet-1
- Predicted directiont = Predicted Pricet – Predicted Pricet-1
- If Actual directiont = Predicted directiont , then Direction = 1. Same direction
- If Actual directiont != Predicted directiont , then Direction = 0. Different direction
- We can now compare the Direction historically to see if we can get the trend right, so as to determine Long/Short position for the month
- We can count the total correct directions for each year and for each month across years to see accuracy of direction
Results, Backtesting Analysis
- Results are given for all assets in the spreadsheet – RoboAdvisorAlgoPart1_7Jan20.xlsx
- Actual Price/Direction
Prediction – Results are good but not accurate enough
- Predicted price consistently below actual price, irrespective of asset type and its date in the series
- Direction prediction is quite good, with atleast 50% accuracy for most assets
- Forward
Price/Direction Prediction – Results are good but not accurate enough
- Predicted price consistently below actual price, irrespective of asset type and its date in the series
- Direction prediction is quite good, with atleast 75% accuracy for most assets for now (Jan ’20)
- Portfolio
Return and Risk – Logic has been built but not backtested
- Tested for a few periods and weight combinations. Results are varied/not good
- Note – Will be done as part of part 2 optimization of weights
- AllAssetAnnualNRR, AllAssetMthlyNRR sheets – contain the actual annual and monthly returns for 1999-2019 for all assets
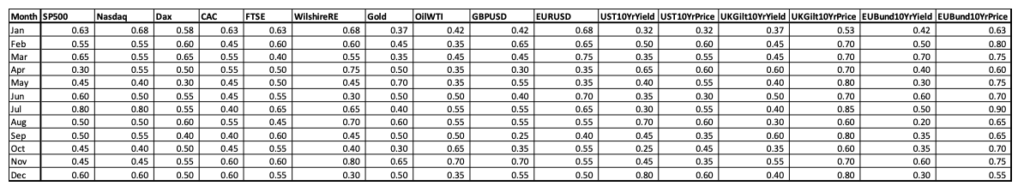
- AllAssetsActPredPrices sheet – Backtested actual data. 75%-85% of Predicted monthly values are within +/- 20% difference from actual
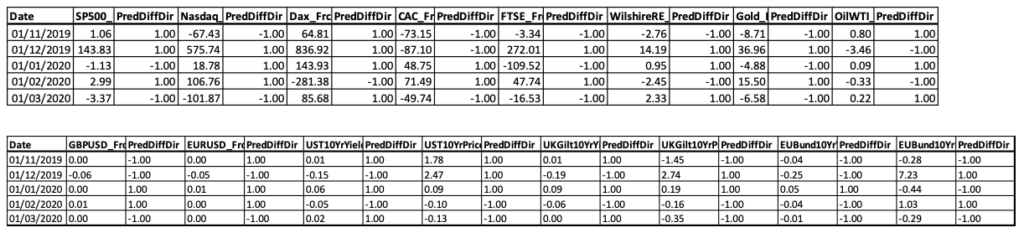
- AllAssetsActPredDirection sheet – Backtested for Actual and Predicted prices, +/- Diff values
indicate monthly asset price move higher/lower in current month compared to
previous
- Dir values indicate if the direction (same/different, 1/0) is same between actual and predicted prices
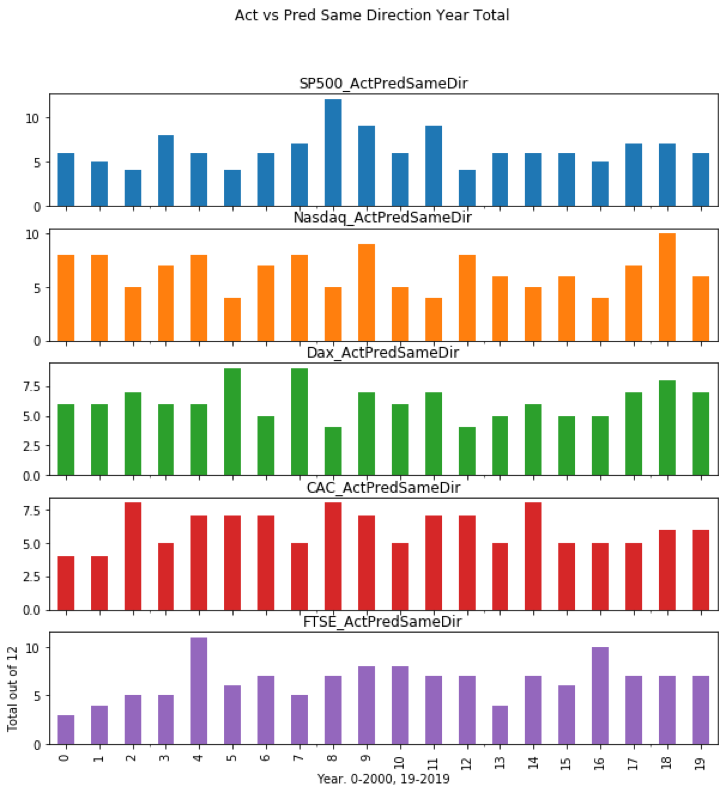
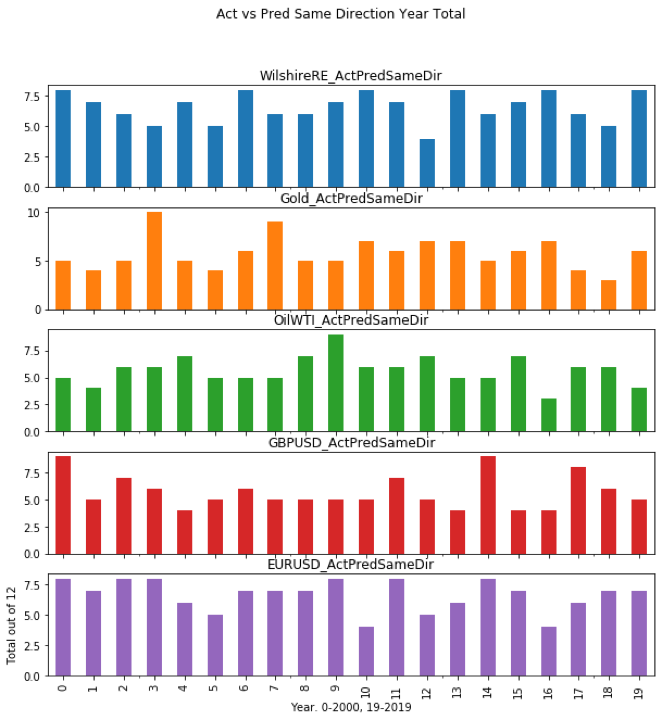
- Price and Direction for each year are shown graphically below, split into asset class group – equities, commodities, currencies, bonds
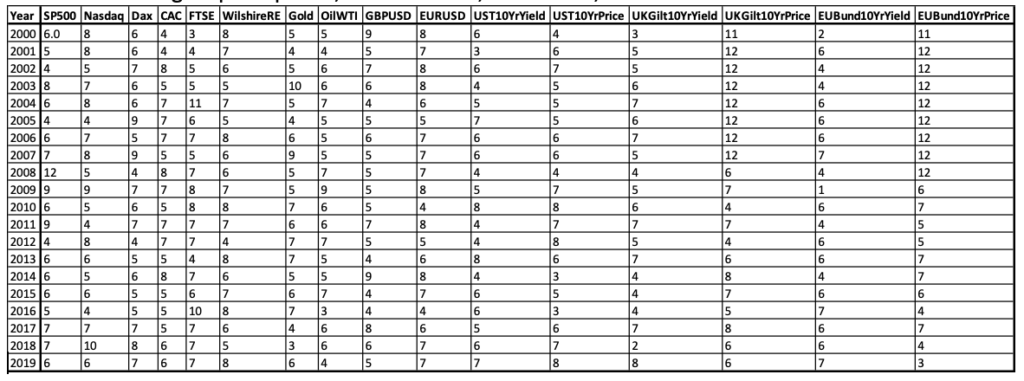
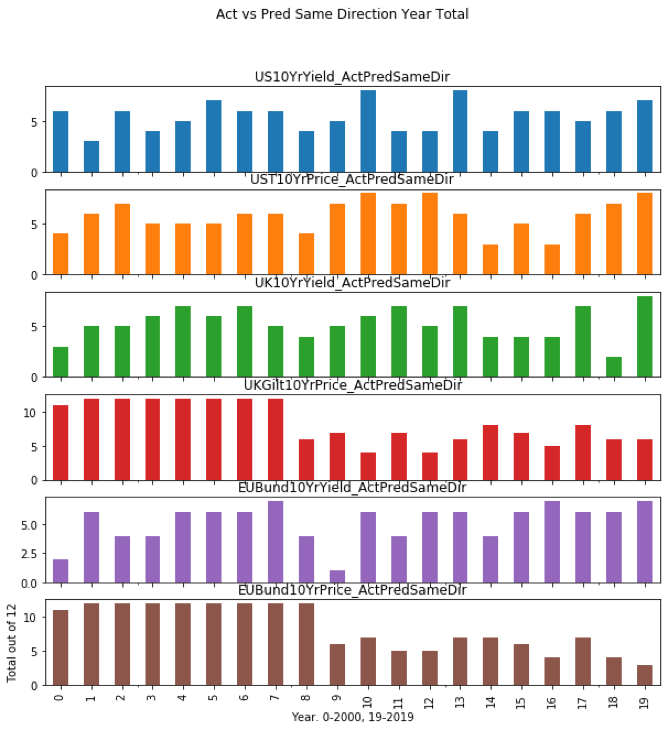
- AllAssetSameDirYrlyTot sheet – Backtested for Actual
and Predicted prices, directional match total for each year
- Total > 5 indicates atleast 50% of the time (6 months out of 12) in the year the direction was predicted accurately
- Results are varied, but for Equities and Commodities/Currencies Total > 5 for most years
- Bond results are slightly worse, possibly due to lack of entire 21 year price data
- Total for each year are shown in a grid and graphically below, split into asset class group – equities, commodities, currencies, bonds
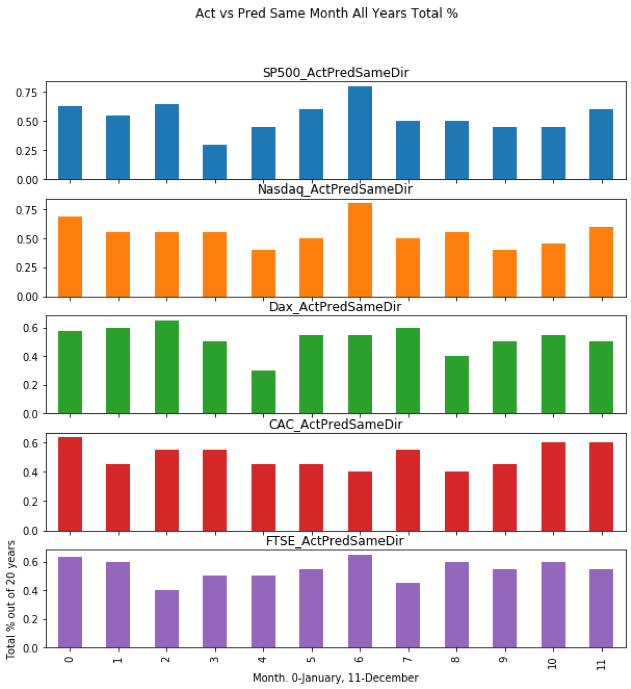
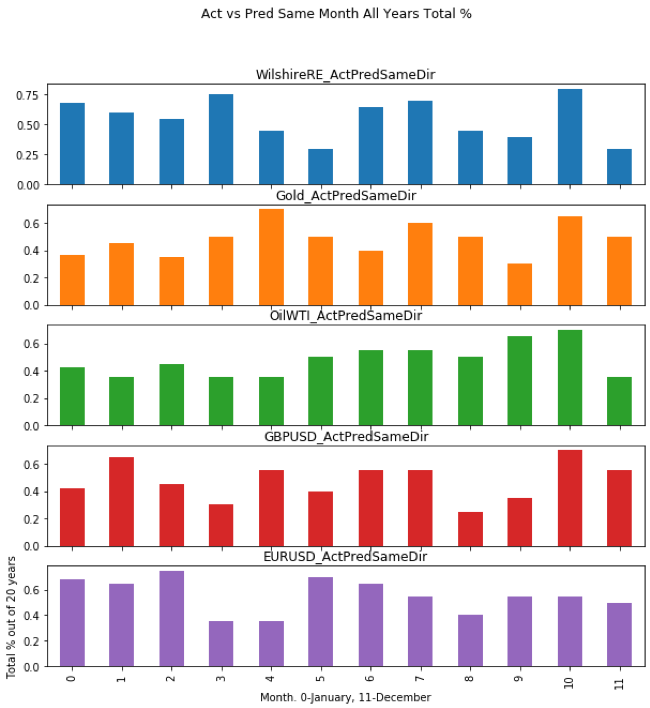
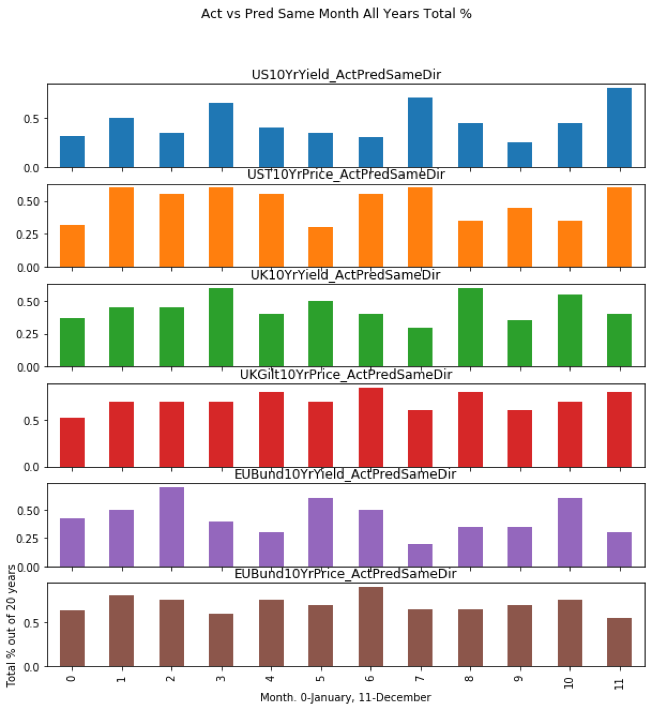
- AllAssetSameDirMthlyTotPct
– Backtested for Actual and Predicted prices, %
total of directional match for each month across all years
- This is used to measure if there are specific months where predicted prices are more accurate
- Eg: Total % same direction matches across January from 2000 – 2019 (20 years)
- Total % > 0.5 indicates atleast 50% of the time (10 years out of 20) that month had same predicted direction as actual
- Results are varied, but only for Equities Total %> 0.5 for most years
- Rest asset types results are slightly worse, possibly due to monthly/seasonal factors
- Total % for each year are shown in a grid and graphically below, split into asset class group – equities, commodities, currencies, bonds
- AllAssetsForecast3YrPrices sheet – contains for all assets the predicted monthly forward prices
for 3 years using all historic macro + central bank macro forecasts
- Predicted forward prices cannot be compared to actual until more real market data becomes available in 2020 and beyond
- AllAssetsForecast3YrDirection sheet – contains for all assets the predicted monthly direction of
forward prices for 3 years
- Overall results are quite good, with atleast 75% accuracy in predicted direction for most assets
- Eg: SP500, Gold – Nov’19, Dec’19 prices were predicted rise / go higher and that was the actual market move. Jan ’20 is predicted lower/fall, and is valid for now
- Eg: OilWTI, GBPUSD – Correct for Nov’19 wrong for Dec‘19. Jan ’20 correct for now
- But results are varied/not correct for some equities, commodities and bonds
- These values will improve as actual macro data becomes available
- Results for a few future months are given in a grid below Results will be published daily in live on a website to compare with actual market regularly
- Note – The current algorithm doesn’t incorporate geopolitical/trade conflicts, elections, comments by politicians, etc. These have an impact and will be incorporated in the algo later in part 2
Conclusion
- While the predicted direction results are quite good but price prediction not as accurate as desired, they still show validity of the algorithm and logic for all assets
- As all possible data has not been considered, this was expected
- As other macro/market data and more samples are included, expectation is that it will improve the results
- It provides a good base to work with to improve the results
- Results further validate prior research on price prediction and correlation between asset prices and macroeconomic data
Further research, ways to improve algorithms
- This is a good starting point as the model can now be improved by
- Further analysis to bring predicted price closer to actual price
- Adding other data types (central bank statements, political statements, etc) and other countries’ data (China, India, Japan, etc) can improve the results, as they are relevant
- Use dimensionality reduction like PCA to see if it improves the results, though it reduces explainability
Published research – Asset Price / Macro data prediction and relationship
- Results of this new research further validate earlier research articles already published
- https://github.com/datawisdomx/Predict-Monthly-Asset-Price-and-Direction-using-Macroeconomic-Data – Predicts monthly asset price for future next 1 month using historic actual macro and asset data
- https://github.com/datawisdomx/Monthly-Asset-price-relationship-to-Macroeconomic-Data – Analyses correlation and coefficient of determination relationship between them
Note – This research is based on a very simple premise and small data set. This by itself is not sufficient for all possible variations to the relationship between macroeconomic data, countries, asset prices, timeframes, algorithms used and other factors like political & central bank data, etc. Users can test that on their own and use as they see fit.
Disclaimer
Legal Disclaimer – This research is not an investment advisory or a sales pitch. Please use this research keeping in mind the disclaimer below.
Please get in touch if you see any errors or want to discuss this further at nitin@datawisdomx.com