


Most data science problems can be solved by following a standard process
Process Flow diagram with some details is given below. This is just one of the many ways to solve data science problems. But the general flow and concepts are similar. It does not cover deep learning and related algorithms but general idea is the same
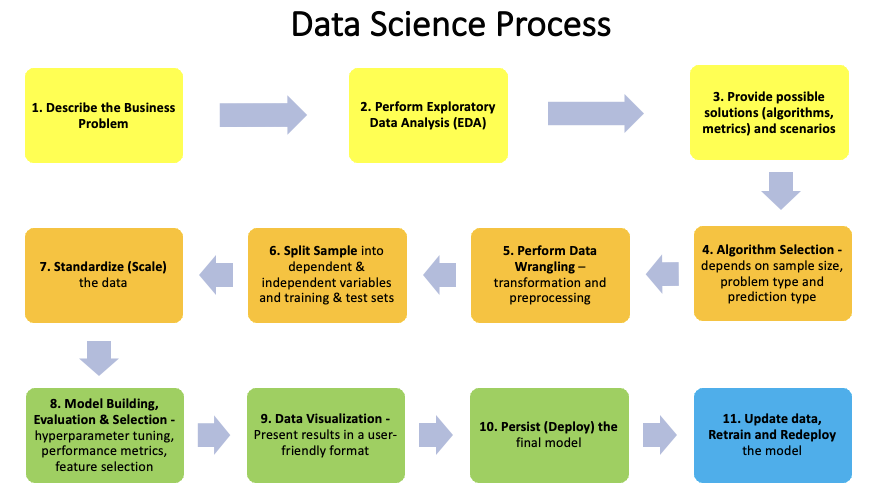
1.Describe the business problem to be solved
1.Understand the business problem that the users are facing which can be solved using data science
2.Assess whether they have the necessary data to build the machine learning model
3.Evaluate the current business process for data sources of the sample data. Identify data quality issues
4.Identify the features (variables) to be predicted (dependent, Y) using the other features in the sample data (independent, X1…Xn)
5.The objective is to build an algorithmic model to predict Y using X1…Xn, where Y = f(Xi), where i = 1 to n
6.Define the data science process steps that will be performed to generate the expected outcomes
2.Perform Exploratory Data Analysis (EDA) to understand the data
Use python or excel and visualization
1.Sources – manual, documents, databases, emails, etc
2.Types/Formats – csv, pdf, txt, json, database, etc
3.Gaps – input accuracy, update frequency, time gaps, missing data, erroneous data, etc
4.Identify data wrangling steps (to be performed in detail later)
3.Provide possible solutions and scenarios
for results and how to interpret them
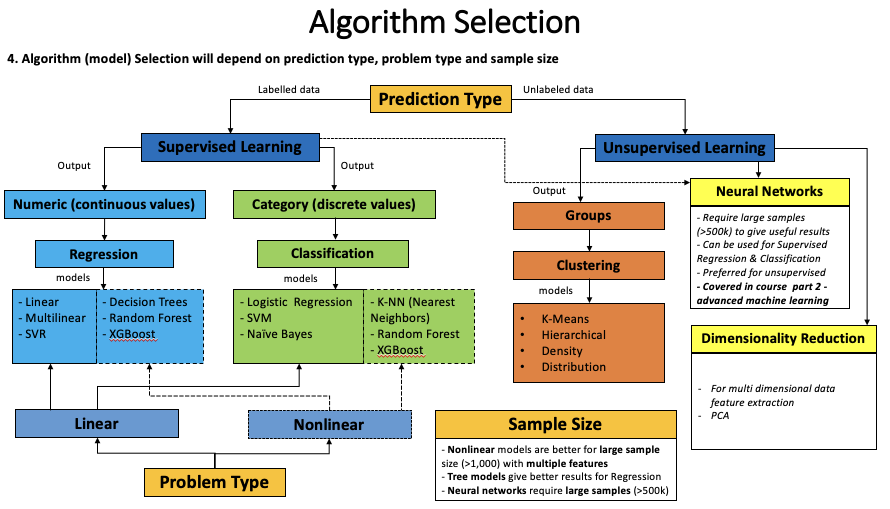
1.What are the possible outputs that can be generated from the machine learning model
2.What type of algorithms can be used – supervised/unsupervised (regression, classification, clustering), deep learning, natural language processing, etc
3.State what the metrics and results would mean numerically and in business terms
4. Algorithm Selection
5. Perform Data Wrangling (transformation, preprocessing)
1.Set of data transformations performed to convert all sample data into a standard format that can be used by different algorithms
2.Missing values, errors, formatting, aggregation, encoding categorical data, binning, etc
6. Split sample data into
1.Dependent (feature Y to be predicted) and Independent (features X1…Xn that are used for prediction) variables
1.Depending on the data and the algorithm used there can be one or more independent variables
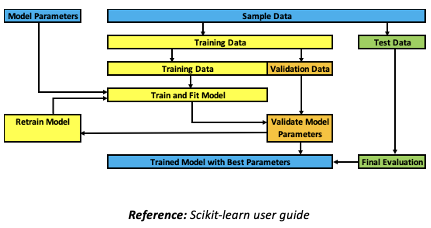
2.Training, Validation and Test sets
1.Training data – large subset of the sample data used to train and fit the model
2.Validation data – small subset of the training data used for evaluating the parameters of the trained model
1.Multiple iterations of training and validating are performed before final evaluation using the test data
3.Test data – small subset of the sample data used for final evaluation of the model parameters using error metrics
4.All 3 splits should be independent and not overlap with each other
5.Splitting into 3 sets reduces the amount of data available for training
1.This can be overcome by using k-fold cross-validation process
3 Train-test split can be done using sklearn’s model_selection train_test_split library (if validation set is not required)
•Try different split ratios to get the best result – 0.2, 0.25, 0.33 etc
4 Random splitting is done to reduce overfitting/underfitting during model training
5 Overfitting/Underfitting – occurs when model is fit too closely to test data or sample size is small. Gives bad predictions with new data
7. Standardizing (Scaling) the data
is required for most algorithms as they are distance based
1.Data must be centred around mean 0, variance 1 (normalization) or mean with variance of the same order
2.Data with higher order variance (outliers) might get a higher weight in the model, causing bad predictions on new data
3.Only training data needs to be standardised and not test data
1.Otherwise test data will use its own mean/standard deviation leading to a badly fit model
4.Standardizing can be done using sklearn’s preprocessing Scale or StandardScaler (which scales and transforms) library
1.The transformer created for training data can then be applied to test data
5.It is not required for models like (Random Forest, XGBoost) as they are not distance based (not sensitive to feature size)
6.Now that the data is in a standard format it can be used by different algorithms (models)
8. Model Building, Evaluation & Selection involves
1.Sample splitting – Training, testing and validating on different subsets of the sample data
2.Model evaluation and Hyperparameter tuning
3.Using error metrics for measuring model accuracy
4.Feature (independent) selection iteratively to remove low importance features, thereby improving model performance without loss of information
5.Result of the above process will select the best trained model with optimized hyperparameters
6.The above process is followed during the building of all models and is shown in all python code examples
7.Useful website – https://scikit-learn.org/stable/model_selection.html
•This can become laborious, computationally expensive and prone to overfitting/underfitting
•It can be simplified into an efficient process by using Pipeline & GridSearchCV libraries together
•Pipeline combines data transformations and training multiple models into a sequence of steps
•Grid search across entire hyperparameter grid to select the best combination for each model
•Hyperparameters to be tuned for each model are setup as a predefined parameter array (grid)
•Running multiple loops of the above using different independent subsets (K-fold cross-validation)
•Benefit – It calls fit and predict only once on the sample data for an entire sequence of models
•Benefit – It avoids leaking statistics from test data into the trained model during cross-validation
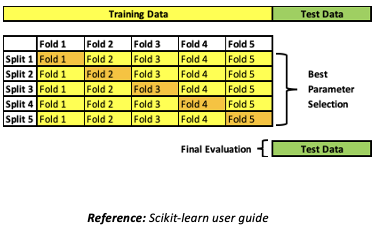
•GridSearchCV performs K-fold cross-validation to train models on multiple variations of the training data of the sample in an iterative loop (k-folds, k-splits) :
1. Each split repeats steps 2 and 3 below in a loop by changing the fold used for validation, resulting in a new split
2. Model is trained using k-1 folds as training data
3. Trained model is validated on the remaining fold of data (using a performance measure like accuracy)
4. The performance measure calculated by k-fold cross-validation is then averaged across all the iterations
•Final evaluation on the test data (split from the sample and not included in the k-folds)
•Performance measures used
•Error metrics for regression
•Minimize MSE, RMSE, MAE etc as they indicate difference between predicted and actual values
•Maximize R2 as it indicates goodness of fit of model
•Evaluation metrics for classification
•Confusion matrix, etc to evaluate accuracy of a classifier
•ROC curve for binary classifiers
9. Data Visualization
involves presenting the results in a user-friendly format using different libraries
•Pandas plot can be used for basic data visualization
•It provides a basic plot function for different chart types called directly on dataframes/series
•Its a wrapper around matplotlib plot function
•https://pandas.pydata.org/pandas-docs/stable/user_guide/visualization.html
•Matplotlib is the most popular and comprehensive python library for data visualization, used for a variety of chart types
•It integrates with python, pandas and numpy making it easy to plot a variety of data
•It provides high flexibility in plotting chart types, axes, colours, markers, 3D plots, etc
•https://matplotlib.org/tutorials/index.htmls
•Seaborn is a python library based on matplotlib
•It provides ease and flexibility for advanced and attractive data visualization
•Eg: heatmaps, multiplot grids, aesthetic figures, statistics plots (model type), etc
•https://seaborn.pydata.org/tutorial.html
•All 3 libraries are used in the examples given for the different algorithms to show their functionality
•Use Excel for tabular presentation and other data manipulations
10. Persist (Deploy)
the final model to a location where it is integrated into the live environment of the overall analytics solution
1.Generally a repository (directory, endpoint) in a cloud hosted storage (AWS S3 bucket) or a local machine
2.Make API calls to the model to return the results for new data
11. Update data, Retrain and Redeploy the model
1.Once the model is deployed in the live environment, it must be retrained (updated) regularly depending on new data sources or more data becoming available
2.If new data sources are considered, start from step 1 of the data science process
3.Retrained model, if better than previous version, should be redeployed to live
4.This process requires full version control of each live model and the data it used
1.Necessary for comparing different versions or rolling-back to the best version in case of issues
More details around data wrangling and other steps will be discussed in future articles.


